Advisory
Load-profile analysis
One year of quarter-hour data shows where your peak comes from, how sharp it is and whether storage can cut it.
4,074 kWp
PV by Equator Solar
3,923 kWh
Storage by Equator Solar
34
Storage projects by Equator Solar
15
Years of Equator Solar
The highest quarter hour of the year decides what you pay for capacity all year.
Sites with RLM metering (the grid operator records your power draw every quarter hour) pay a capacity charge, the Leistungspreis, set by the highest quarter hour of the billing year. Annual consumption in kWh cannot size storage on its own, because two sites with the same consumption can have very different peaks. Your load profile, the full record of those quarter-hour values, shows the peak, and the analysis tells you whether a feasibility study is worth doing at all.
35,040
Quarter-hour values evaluated per year
1
Peak quarter hour sets the annual capacity charge
What you get and what we need
What you get
You get a first sizing worked out from your own metered data.
We evaluate every one of the 35,040 quarter-hour values in your annual load profile and sort the peaks by height, frequency, timing and predictability. The result is a first sizing band in kW (power) and kWh (stored energy), or a clear written statement that storage does not fit your site.
- Evaluation of all 35,040 quarter-hour values of one year
- Peak analysis: height, frequency, time of day, predictability
- Load duration curve (every quarter hour of the year, sorted by load)
- Peak drivers by shift and process
- First sizing band in kW and kWh, or a clear statement that storage does not fit
- Written recommendation for the next step
35,040
Quarter-hour values evaluated per year
1
Peak quarter hour sets the annual capacity charge
What we need from you
We need twelve months of metered data from your site.
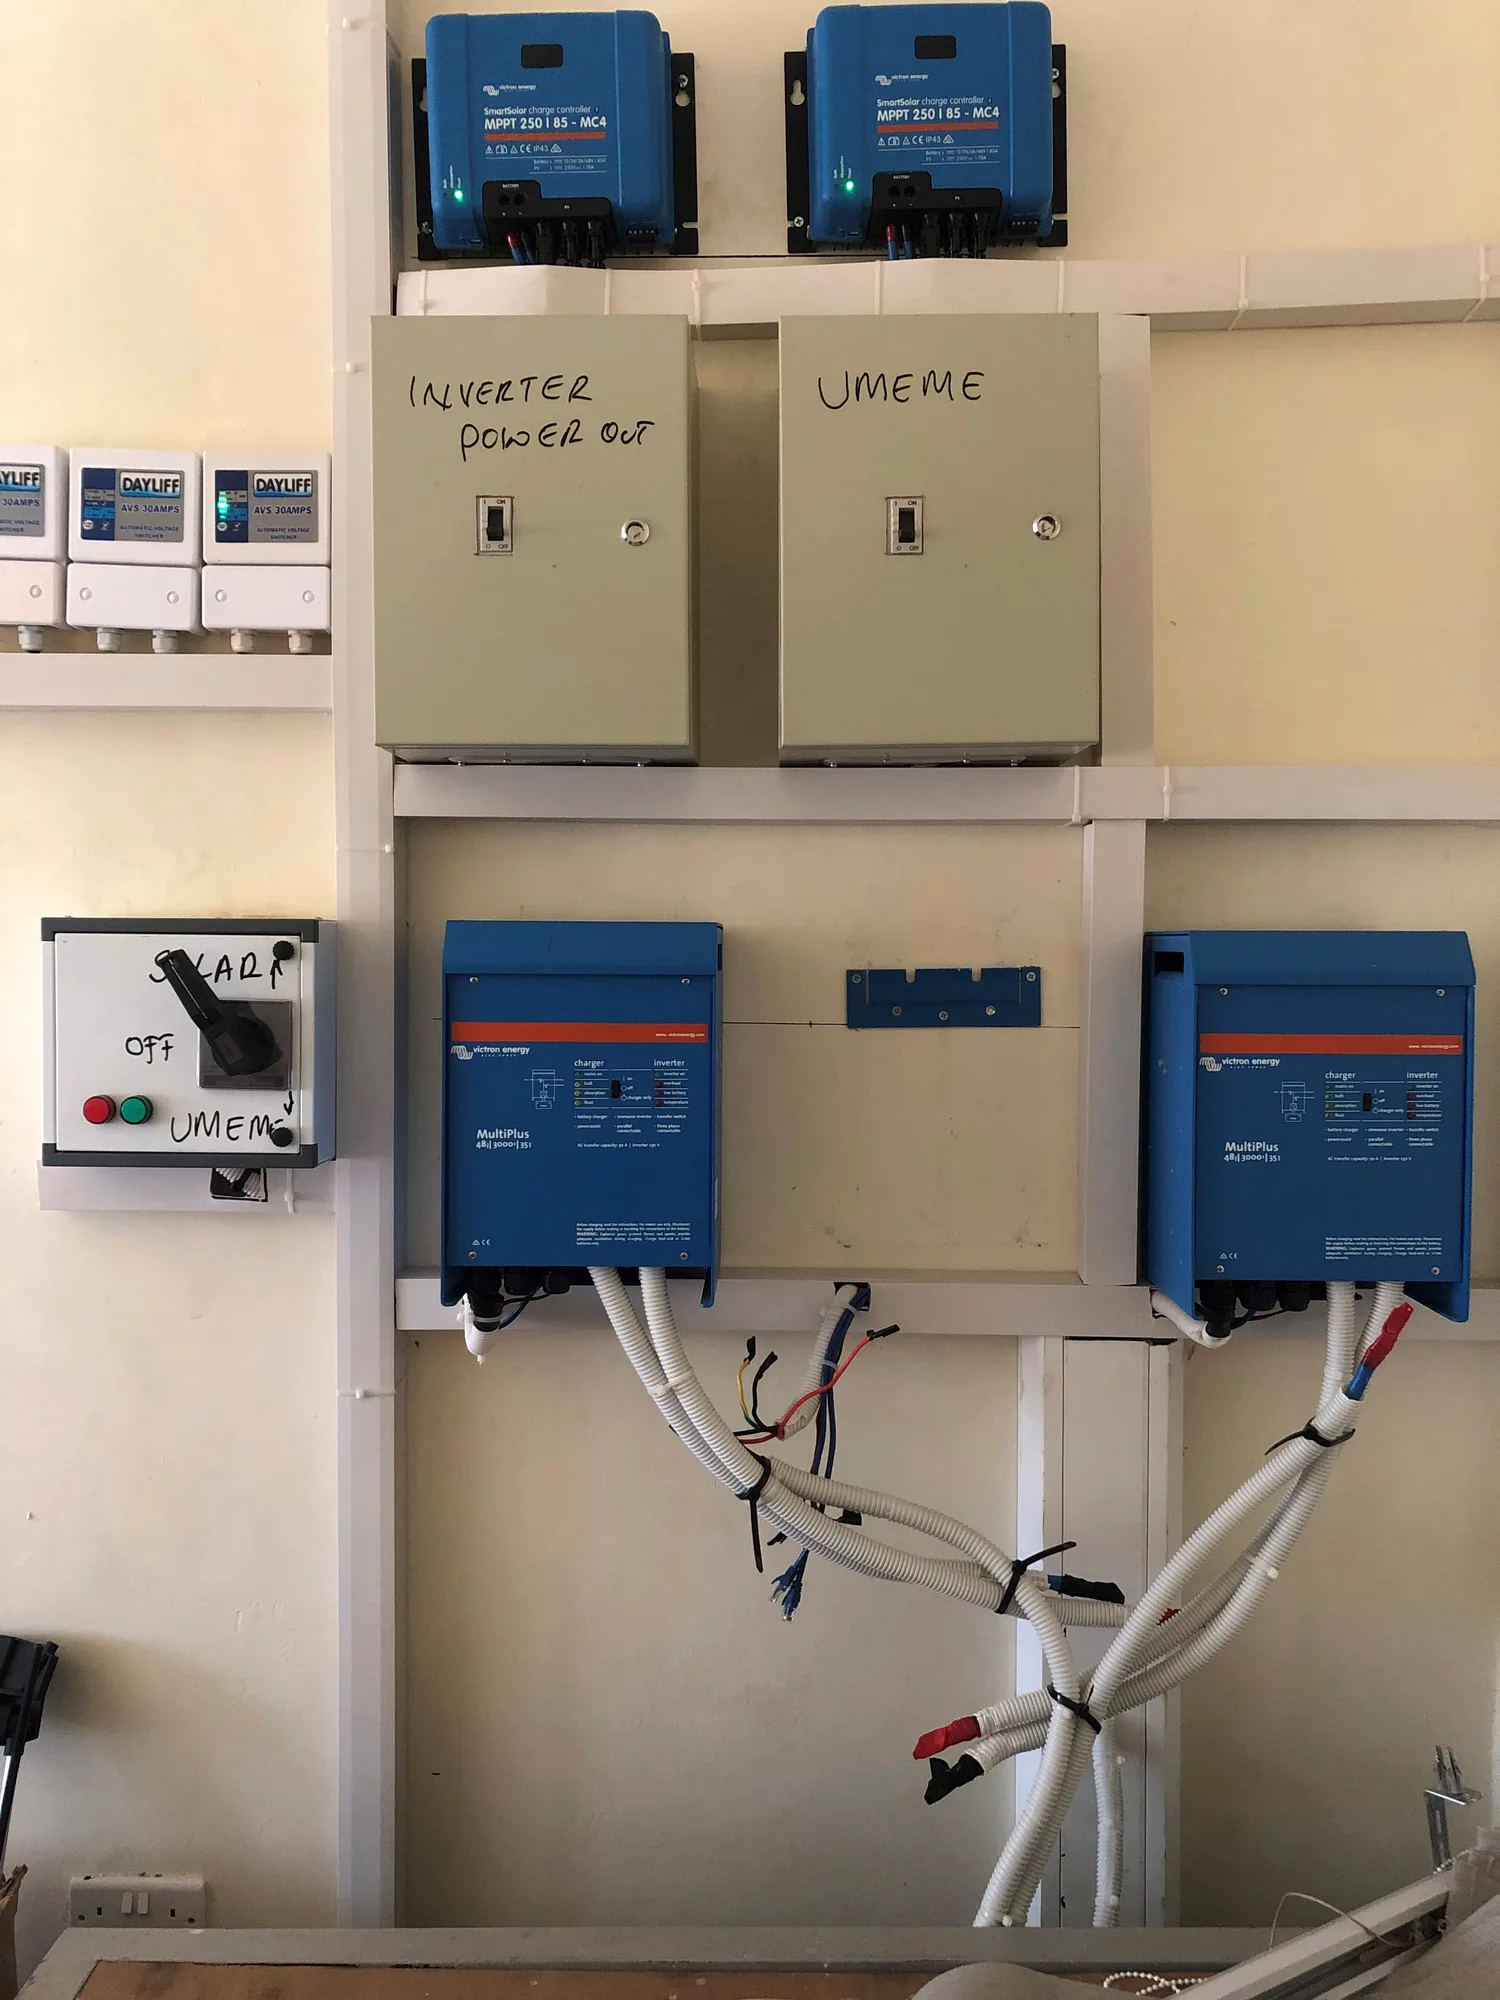
We work from your own metered load data instead of estimates, so the analysis is only as good as the data you send us. Twelve months of quarter-hour data and your electricity bills are the minimum. A single-line diagram of your electrical system and any existing PV data make the result more precise.
- RLM load profile for 12 months (from the grid operator or metering point operator portal)
- Electricity bills for 12 months
- Single-line diagram if available
- Existing PV data
- Planned load changes
How it runs
Four steps from your data to a written recommendation.
Data request and check
We ask for twelve months of quarter-hour data and check it for gaps or metering errors.
Evaluation
We evaluate every quarter-hour value against the peak, the load duration curve and the shift pattern.
Results call
We walk you through the findings and the first sizing band on a call.
Short written report
You receive a short written report with the recommendation for the next step.
Role and fee
This is how we are engaged on this service and how the fee is set.
One role per project
On every project we take one of two roles, never both. As independent advisor we are paid a fee, earn nothing on hardware and take no commission from manufacturers or installers. As turnkey partner we deliver the system through vetted installation partners under one contract. If we wrote the specification or evaluate the bids, we do not bid.
Fee
Load-profile analysis, feasibility studies, quote reviews and acceptance tests are offered at a fixed price agreed on the scope. Owner's engineering is billed by day rate or as a fixed fee. Turnkey delivery is a fixed-price contract.
The figures and references on this site are projects of Equator Solar Systems Ltd in East Africa. The contracting party for ZNX services is ZNX Energy GmbH.